> For the complete documentation index, see [llms.txt](https://3dpaws.comet.ucar.edu/llms.txt). Markdown versions of documentation pages are available by appending `.md` to page URLs; this page is available as [Markdown](https://3dpaws.comet.ucar.edu/3d-printed-automatic-weather-station-3d-paws/testing-and-data-validation.md).
# Testing and Data Validation
Historical 2016–2017 testing of 3D-PAWS sensors, with guidance for interpreting results and forthcoming independent validation.
### Overview
3D-PAWS has undergone laboratory testing, wind tunnel testing, and field comparison with calibrated reference instruments throughout its development.
The results presented on this page document an **early evaluation of the 3D-PAWS system conducted primarily from 2016–2017** at the NCAR Marshall Research Facility in Boulder, Colorado, and the NOAA Testbed Center in Sterling, Virginia.
These results provide an important baseline for the development of 3D-PAWS, but they should not be interpreted as a performance evaluation of the current system. Since this study was completed, 3D-PAWS hardware, sensors, 3D-printed components, electronics, software, and deployment practices have continued to evolve.
{% hint style="info" %}
**Updated evaluation:** A more recent independent comparison of 3D-PAWS observations with a reference weather station has been conducted through TSMS. Results will be added to this manual when the final WMO report is available.
{% endhint %}
***
#### Historical 2016–2017 Evaluation
The original 3D-PAWS meteorological sensors were evaluated through laboratory calibration, wind tunnel testing, and comparison with calibrated commercial reference instruments.
The results below document the sensors and configurations used during that evaluation period and provide a historical record of system performance.
{% hint style="warning" %}
Sensor models and station configurations have changed since this evaluation. The performance values below apply to the sensors and configurations tested during the 2016–2017 study and should not be assumed to represent all current 3D-PAWS configurations.
{% endhint %}
***
#### Laboratory and Wind Tunnel Testing
Before field evaluation, temperature, pressure, and relative humidity sensors were calibrated in a controlled environment. Laboratory results were within the manufacturers' specifications.
The 3D-PAWS tipping bucket rain gauge was tested using simulated rainfall rates from **0.1 to 30 mm/h**, with less than **5% error** during these tests.
The 3D-PAWS 3-cup anemometer and wind vane were tested and calibrated in a NOAA wind tunnel at the NOAA Testbed facility.
Testing included wind speeds up to **70 m/s**. The 3-cup anemometer performed well at these high wind speeds, and wind direction measurements remained consistent across the tested range.
***
#### Field Evaluation
Field evaluations were conducted at:
* **NCAR Marshall Research Facility** – Boulder, Colorado
* **NOAA Testbed Center** – Sterling, Virginia
3D-PAWS observations were compared with calibrated commercial reference instruments.
Reference observations were matched with 3D-PAWS observations at **1-minute resolution** to estimate measurement error.
Where possible, observations were also evaluated by:
* daytime and nighttime conditions
* warm and cold seasons
* environmental conditions that could affect sensor performance
The primary evaluation period was **June 2016 through March 2017**, although evaluation periods varied by sensor and data availability.
***
#### Reference Instruments
The following instruments were used as references during the field evaluation.
| Measurement | NCAR Marshall Research Facility | NOAA Testbed Center |
| --------------------- | ----------------------------------------- | --------------------------------------------------------------- |
| **Temperature** | Campbell Scientific 500 series sensor | Technical Services Laboratory 1088 hygrothermometer |
| **Pressure** | Vaisala PTB101B | Coastal Environmental Systems PDB-1 precision digital barometer |
| **Relative Humidity** | Campbell Scientific 500 series sensor | Technical Services Laboratory 1088 hygrothermometer |
| **Wind Speed** | R.M. Young 05108 anemometer | Vaisala 425NWS ice-free wind sensor |
| **Wind Direction** | R.M. Young 05108 anemometer | Vaisala 425NWS ice-free wind sensor |
| **Precipitation** | Geonor T-200 weighing precipitation gauge | OTT AWPAG weighing precipitation gauge |
***
#### Temperature
Temperature observations were evaluated at both test sites, with similar measurement performance.
Three temperature sensors were integrated into the 3D-PAWS configuration used during this evaluation:
* BMP180
* HTU21D
* MCP9808
All three sensors agreed well with the calibrated reference sensor over the observed temperature range of approximately **−25°C to 37°C**.
For the NCAR Marshall evaluation, the reported measurement error for all observations was:
**±0.57°C**
The error was slightly larger during daytime observations and lower at night. The original evaluation attributed this difference to solar heating of the radiation shield during the day.
**Figure 1.** Temperature sensor evaluation. From left to right: all observations, daytime observations, and nighttime observations.
***
#### Atmospheric Pressure
Barometric station pressure was evaluated at both test sites, with similar performance observed.
The **BMP180** pressure sensor was used in the 3D-PAWS configuration evaluated during this study.
For the NCAR Marshall evaluation from June 2016 through March 2017, the reported measurement error for all observations was:
**±0.49 hPa**
When separated by time of day:
* daytime: **±0.53 hPa**
* nighttime: **±0.37 hPa**
The original evaluation attributed the slightly larger daytime error to heating and greater daytime temperature variation.
**Figure 2.** Atmospheric pressure sensor evaluation. From left to right: all observations, daytime observations, and nighttime observations.
***
#### Relative Humidity
Relative humidity sensors were evaluated at both the NCAR Marshall Research Facility and NOAA Testbed Center, with similar behavior observed at both sites.
The reported mean measurement error was:
**±5.7% RH**
When separated by time of day:
* daytime: **±5.98% RH**
* nighttime: **±4.87% RH**
The evaluation found substantial scatter in the mid-humidity range of approximately **20–80% RH**, along with a low bias at very low (**<10%**) and very high (**>90%**) relative humidity.
Occasional anomalous behavior was also observed. The original evaluation suggested that condensation on either the 3D-PAWS or reference sensor may have contributed.
**Figure 3.** Relative humidity sensor evaluation. From left to right: all observations, daytime observations, and nighttime observations.
***
#### Wind Speed and Direction
Wind speed and wind direction observations were compared with calibrated reference measurements.
The reported wind speed measurement error was:
**±0.87 m/s**
When separated by time of day:
* daytime: **±0.94 m/s**
* nighttime: **±0.79 m/s**
The 3D-PAWS wind measurements generally agreed with the predominant wind observed by the reference sensor.
The reported wind direction measurement error was less than: **±5°**
***
#### Precipitation
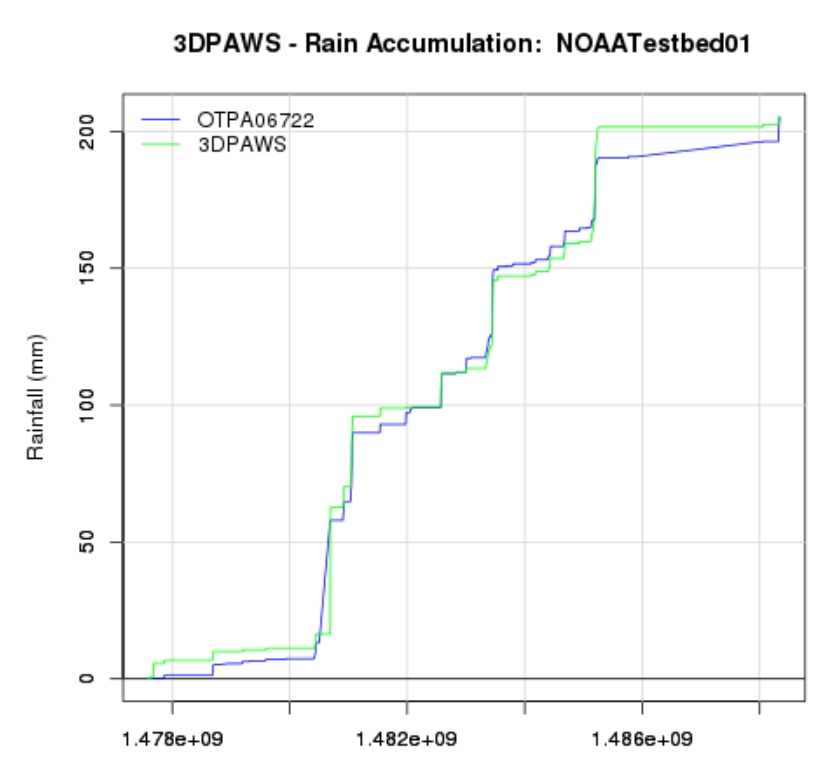
The 3D-PAWS tipping bucket rain gauge was compared with the NOAA Testbed weighing precipitation gauge from **October 2016 through March 2017**.
Approximately **200 mm of precipitation** was recorded during the evaluation period.
Total accumulation showed good agreement between the gauges. Small differences were observed during individual precipitation events, which the original evaluation attributed primarily to wind and precipitation-rate effects.
**Figure 4.** Rainfall accumulation observed by the 3D-PAWS tipping bucket rain gauge and NOAA weighing-gauge reference sensor.
***
#### 2016–2017 Evaluation Summary
The original evaluation concluded that the tested 3D-PAWS sensors generally compared well with calibrated reference instruments.
The following values were reported in the original evaluation summary:
| Measurement | Resolution | Reported Performance |
| --------------------- | ---------: | -------------------: |
| **Temperature** | 0.1°C | ±0.4°C |
| **Pressure** | 0.1 hPa | ±0.4 hPa |
| **Relative Humidity** | 1% | ±5.7% |
| **Wind Speed** | 0.1 m/s | ±0.8 m/s |
| **Wind Direction** | 1° | ±5° |
| **Rainfall** | 0.2 mm | 10% |
{% hint style="warning" %}
These values are retained here as originally reported and should not be interpreted as performance specifications for current 3D-PAWS sensors.
{% endhint %}
Relative humidity showed greater variability than the other evaluated measurements, including bias at very low and very high humidity and larger-than-expected errors across the middle of the measurement range.
***
#### Interpreting the Historical Results
The 2016–2017 evaluation demonstrated that the early 3D-PAWS system could produce useful meteorological observations when compared with calibrated reference instruments. It also identified areas for improvement, particularly relative humidity measurement.
These results helped inform the continued development of 3D-PAWS.
**The system has evolved substantially since this evaluation, including changes to sensors, electronics, 3D-printed components, software, and deployment practices.**
For this reason, the results on this page should be viewed as a **historical performance baseline rather than a characterization of the current 3D-PAWS system**.
***
#### Current Validation
3D-PAWS continues to be evaluated as the system develops.
A more recent independent comparison of 3D-PAWS observations with a reference weather station has been conducted through **TSMS**. Results are expected in a forthcoming **WMO report**.
Once the final report is available, its findings will be incorporated into this manual to provide a more current independent assessment of 3D-PAWS performance.
Until then, users should evaluate observations from individual deployments using the current siting, installation, metadata, maintenance, and data-quality guidance provided throughout this manual.
---
# Agent Instructions
This documentation is published with GitBook. GitBook is the documentation platform designed so that both humans and AI agents can read, navigate, and reason over technical content effectively. Learn more at gitbook.com.
## Querying This Documentation
If you need additional information that is not directly available in this page, you can query the documentation dynamically by asking a question.
Perform an HTTP GET request on the current page URL with the `ask` query parameter, and the optional `goal` query parameter:
```
GET https://3dpaws.comet.ucar.edu/3d-printed-automatic-weather-station-3d-paws/testing-and-data-validation.md?ask=&goal=
```
`ask` is the immediate question: it should be specific, self-contained, and written in natural language.
`goal` is optional and describes the broader end goal you are ultimately trying to accomplish on behalf of the user. GitBook uses it to tailor the answer towards what is most useful for that goal.
The response will contain a direct answer to the question and relevant excerpts and sources from the documentation.
Use this mechanism when the answer is not explicitly present in the current page, you need clarification or additional context, or you want to retrieve related documentation sections.